BeneBits™
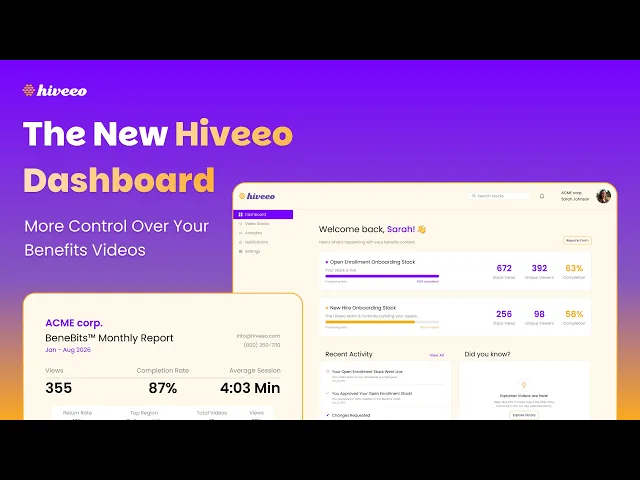
Introducing the New Hiveeo Dashboard: Your Stacks and Analytics, All in One Place

Hi, I'm Alex, Head of Product here at Hiveeo. I'm excited to give you a first look at some of the biggest updates we've made to the product: the new Hiveeo dashboard.
This dashboard is now the centralized home for everything you do with Hiveeo. From here, you can manage and create stacks, track their progress, and dig into your analytics — all in one place.
Manage Your Stacks From Start to Finish

The new Stacks view shows you exactly where each of your stacks is in the process:
Live stacks show overview data points at a glance.
Stacks in progress show real-time build status, updated as our team makes progress.
Once a stack is ready for your eyes, you can review it, request changes, and approve and publish it — all directly from the dashboard.
Creating a New Stack: From Hours to Minutes
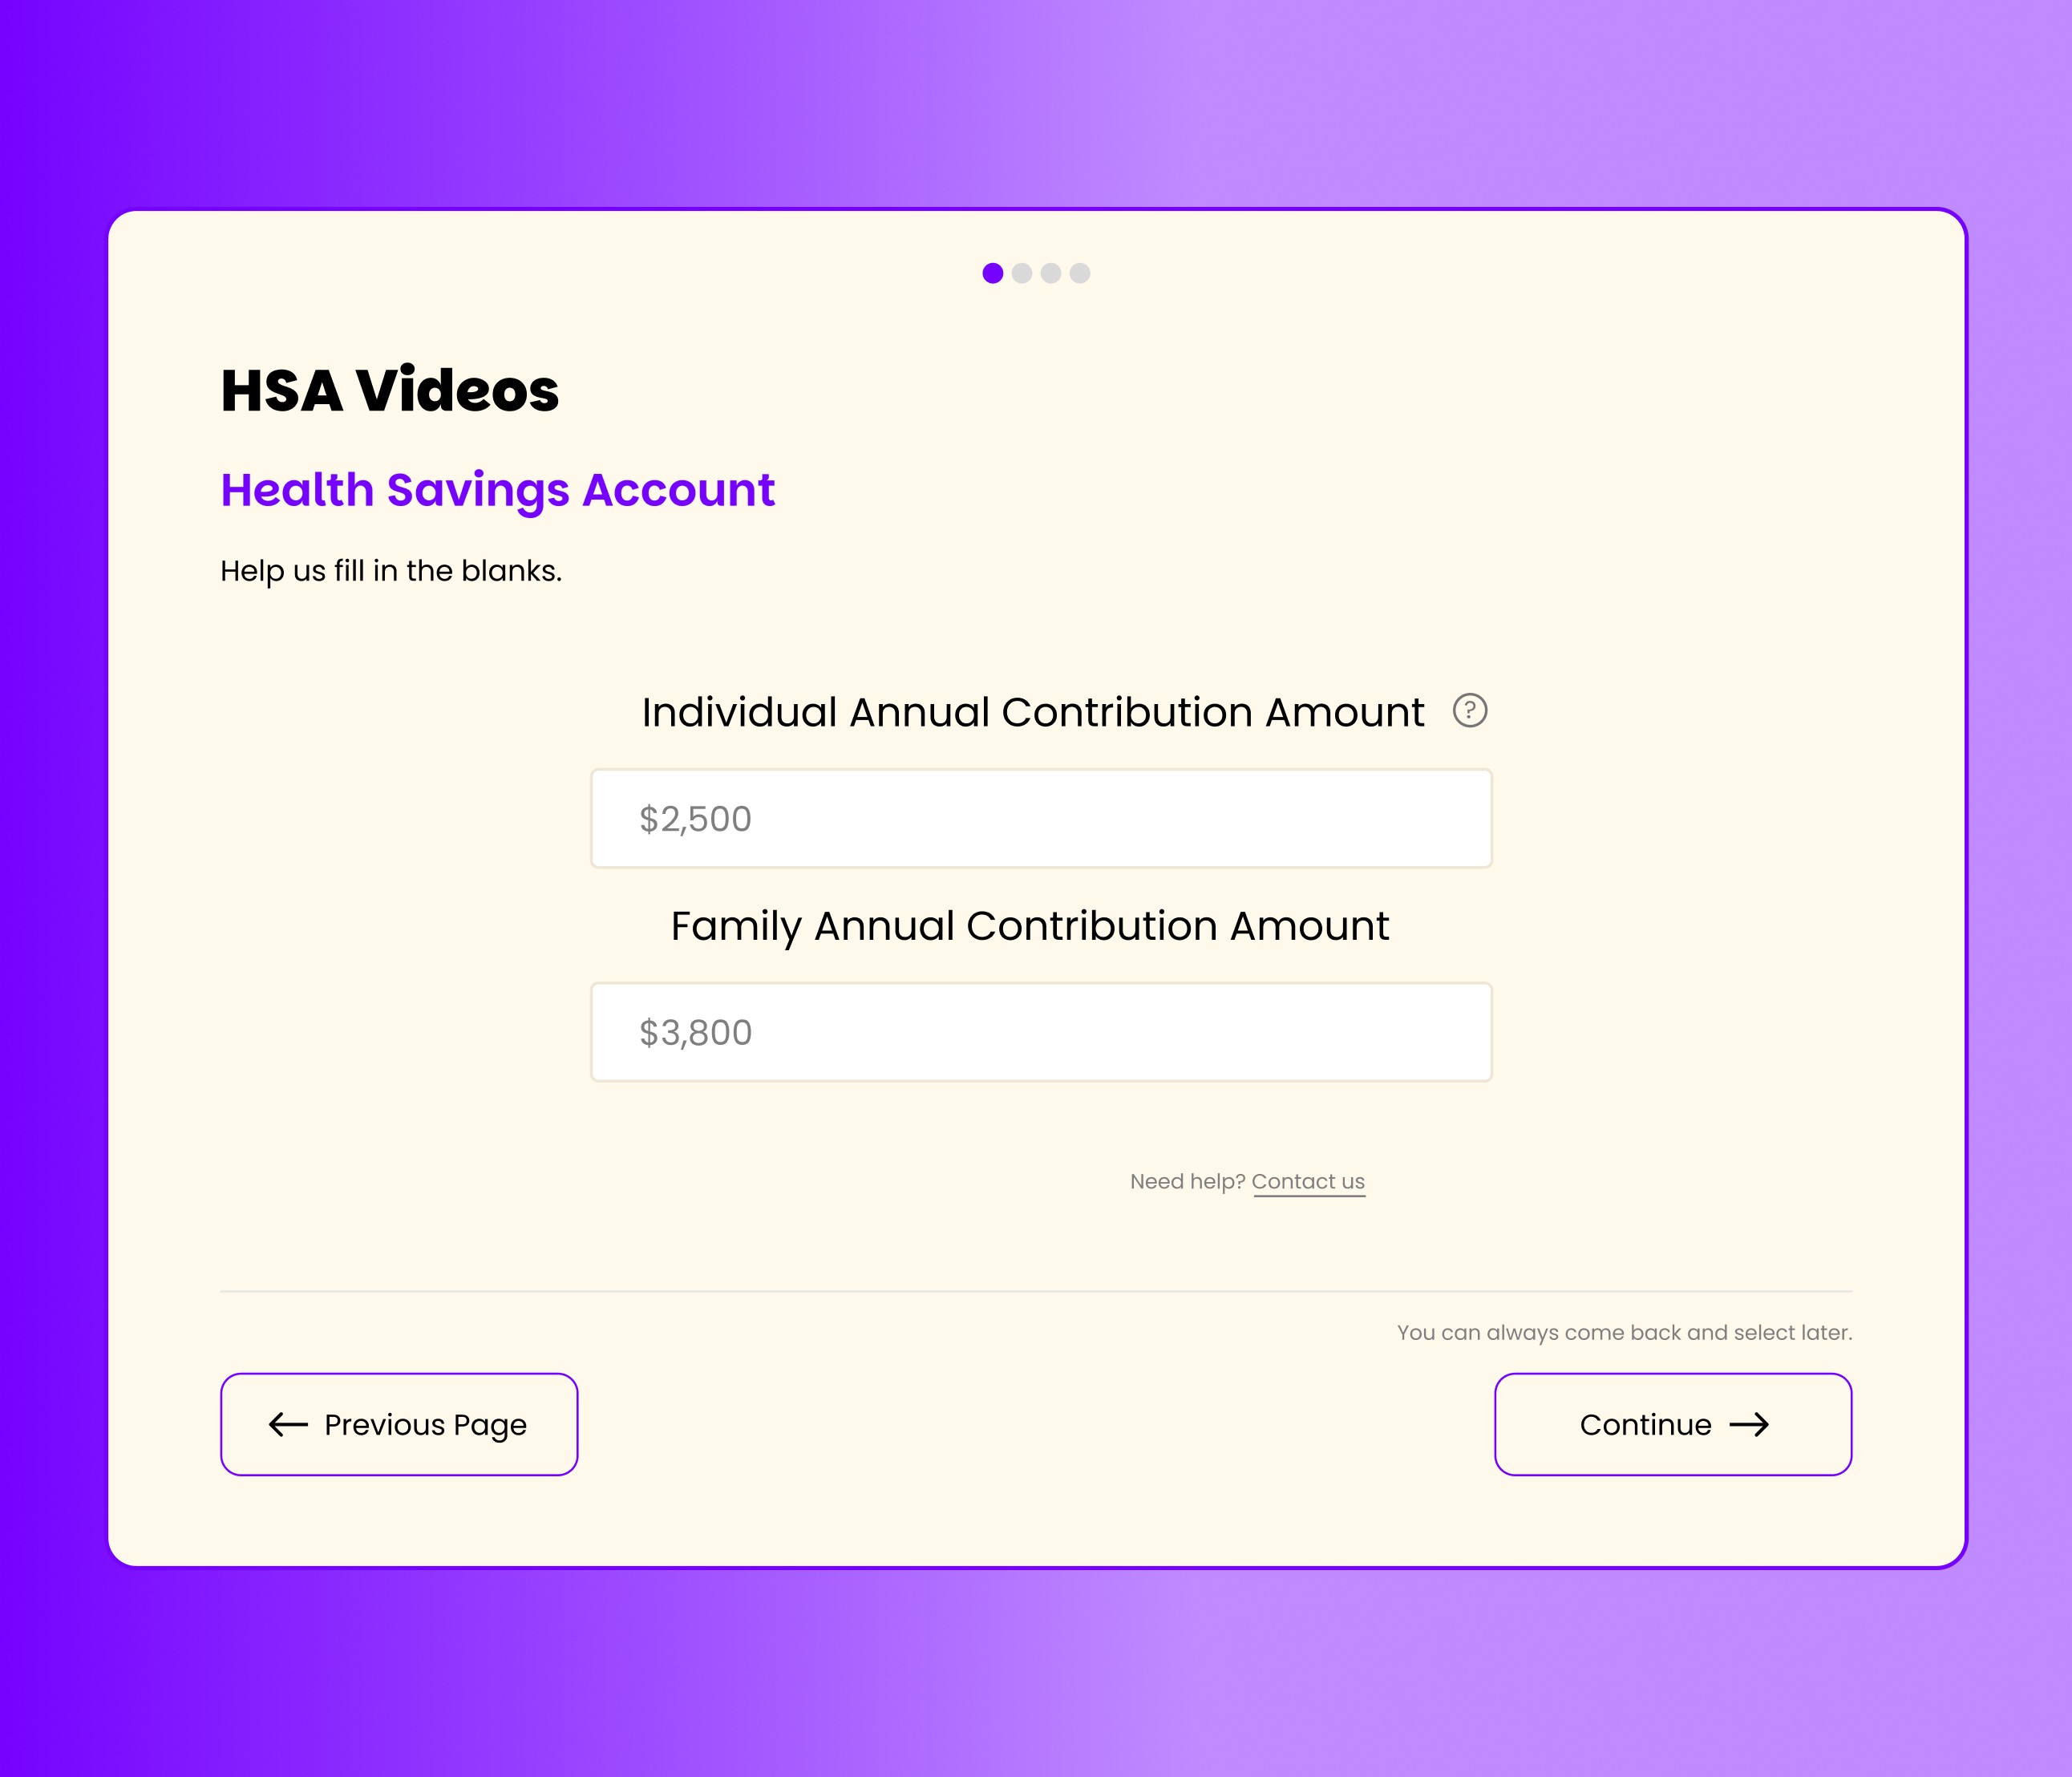
The Video Stacks view lets you see and edit all of your stacks, and creating a new one has never been faster.
Our old process relied on a long, dense PDF that could easily take hours to fill out. We've replaced it entirely with a guided, multi-step online form that walks you through the exact same information — but you can complete the whole thing in about 15 minutes.
Along the way, you can:
Choose the type of stack you want to create
Preview creative options when a video has more than one direction to choose from
Fill in your details through a simple, guided online form
Upload attachments like benefit summaries, logos, or images
Review everything and submit
As soon as you submit, our team is notified and gets straight to work on your stack.
Real-Time Analytics, Finally in Your Hands
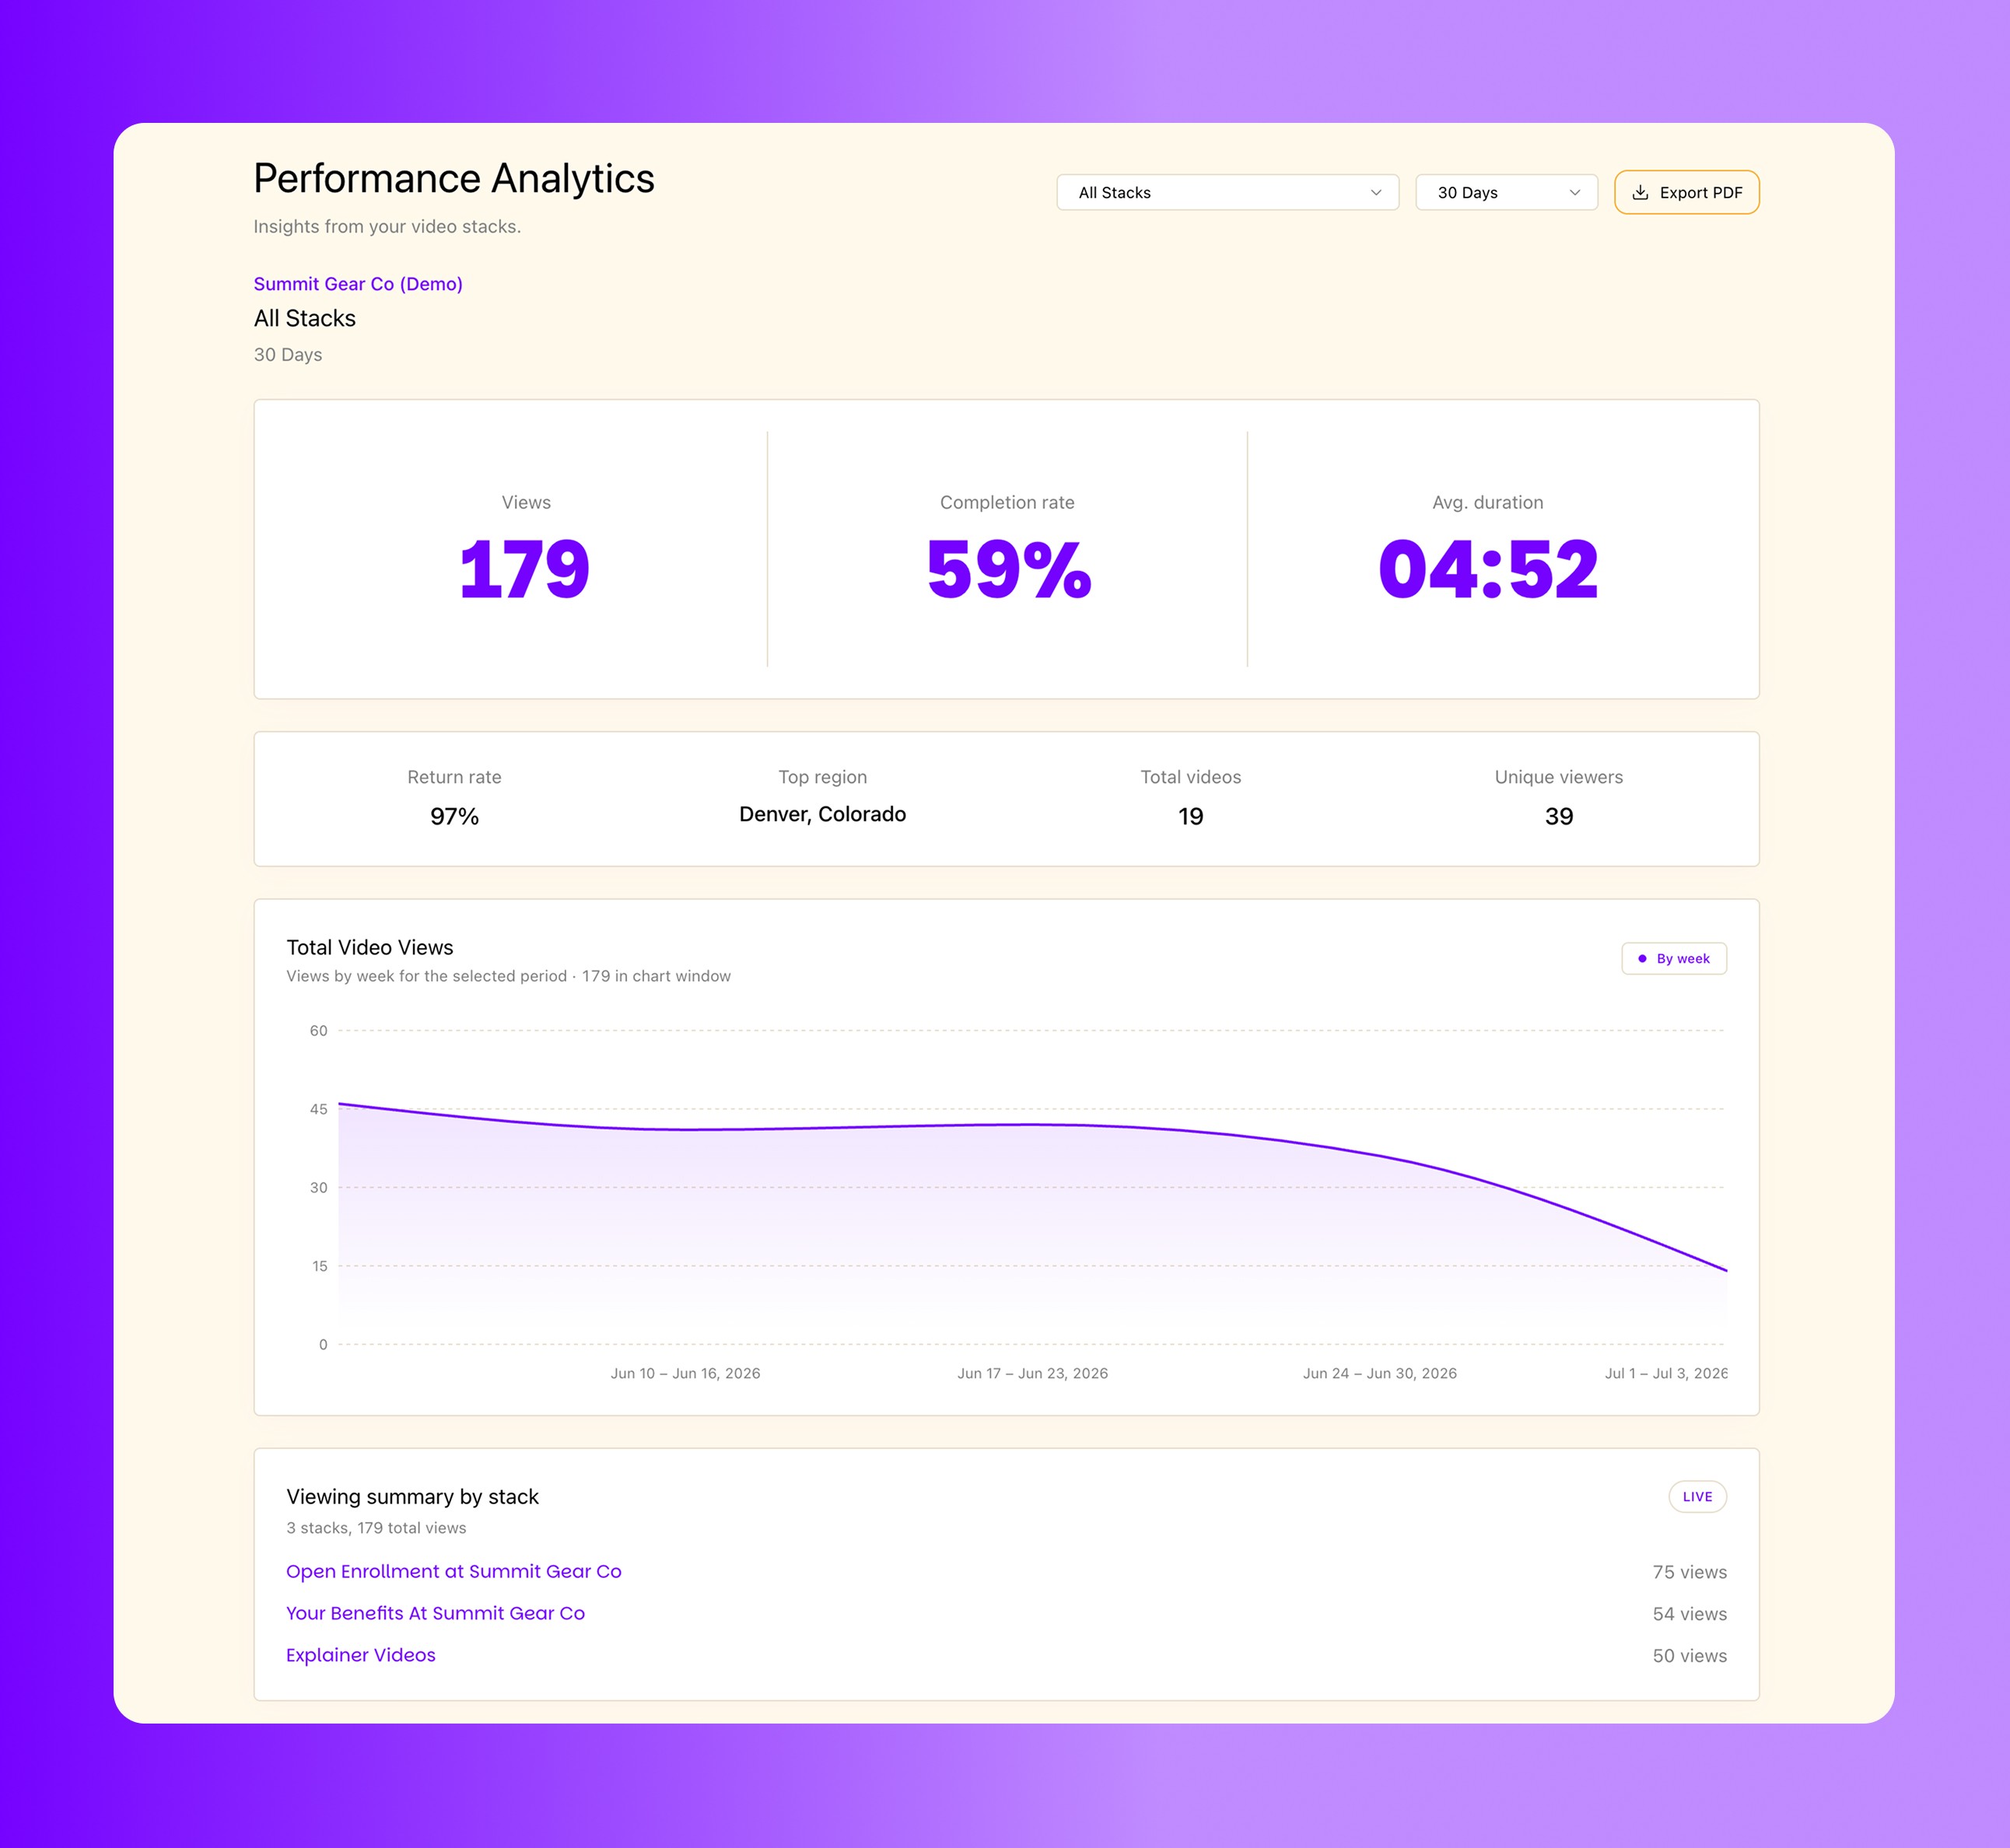
The feature we're most excited about is the completely revamped analytics page.
In the past, you had to wait for us to send monthly or annual reports to understand how your stacks were performing. Now, that power is in your hands. Analytics update daily, giving you near real-time visibility into performance.
With the new dashboard, you can:
View performance across all your stacks, or drill into a single stack
Choose custom date ranges — for example, checking views in the final week before open enrollment
See device usage, top-performing videos, and top regions
Understand where users drop off and where they return, and how often
Review a complete performance breakdown for each individual video
Export a PDF report to share results with upper management or anyone else in your organization
We'd Love to Show You More
This is just a first look at everything the new dashboard has to offer. We'd love to walk you through it in more depth and answer any questions you have.
Reach out to us to schedule a demo — we can't wait to see how you put it to use.